For the first time in about 15 years, U.S. stocks are finally priced to produce an average long-term return (10% annually). This is good news. Ten years ago, stocks were priced to produce a lousy long-term return--and they have.
Fund manager John Hussman explains this in detail below. Unlike Jeremy Grantham and Robert Shiller, who look at "normalized" earnings by applying average profit margins, Hussman uses "peak" earnings, which are similarly mean-reverting. "Normalizing" earnings is critical, because profit margins (and earnings) are so volatile through the cycle. Both of these methods for "normalizing" work.
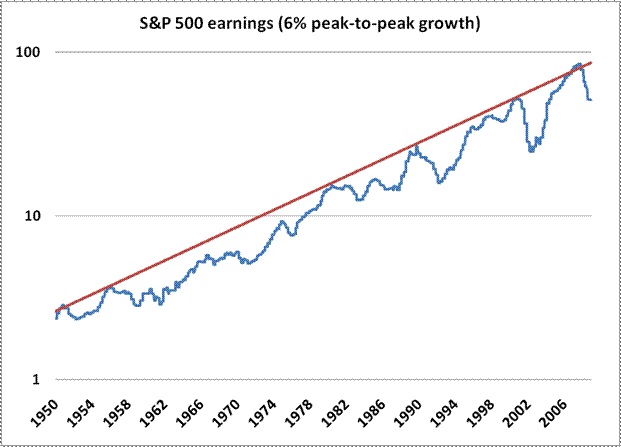
As the chart below shows, peak earnings in each business cycle have grown at a steady 6% over the past 60 years. As Hussman explains, applying a "peak" multiple to these peak earnings suggests that stocks are modestly undervalued today. This doesn't mean they won't go lower over the next few months or years. It does mean that, over the next decade--as opposed to over the past one--stocks should do fine.
(This also doesn't mean that you should take what money you have left and plunge it all into the stock market. It just means that, if you're worried about continuing to add to your retirement fund stock allocation, you shouldn't be. In fact, you should feel better about it than you have anytime in the last 15 years.)
The chart below shows the path of S&P 500 earnings since 1950. Notice that while earnings are extremely variable (and in fact, are more variable than stock prices themselves), the growth rate from peak-to-peak across economic cycles has been remarkably stable at about 6% annually.

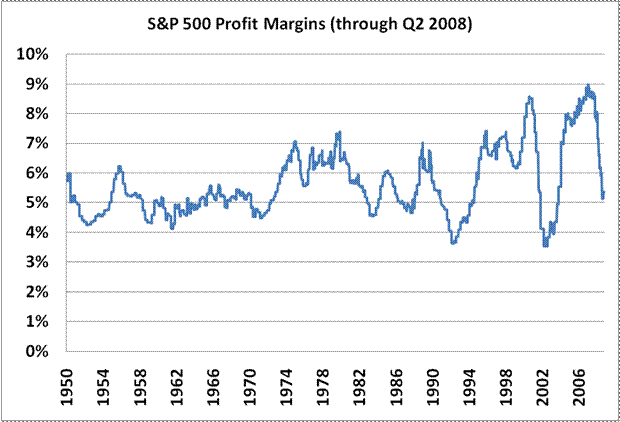
Not surprisingly, nearly all of the cyclical fluctuation in earnings has been driven by fluctuations in profit margins (revenues have dramatically less volatility). Profit margins tend to mean-revert over time – a fact that some analysts dismissed in recent years, but is suddenly no longer a subject of debate.

So there is enormous variability in earnings over the business cycle, and a lot of that variability is “noise.” We would never want to use a straight P/E multiple to value the market, because historically there has been more variability in the “E” than in the “P” – and that's despite the fact that earnings have actually been very well-behaved on a peak-to-peak basis. Likewise, we observe an enormous amount of variability in profit margins. Even with long-term improvements in productivity, margins still fluctuate and revert to the mean. That mean might have risen slightly over the decades, so that peak earnings used to occur at 6-7% margins, and a conservative estimate might now be closer to 8%, but it's clear that most of the variation in profit margins is cyclical “noise.”
To adjust for that noise, we have to form our valuation multiples based on some smooth fundamental rather than a noisy, cyclical, mean-reverting one. This is essential, because stocks aren't a claim on next year's earnings – they are a claim on a very long-term stream of cash flows, and short-term variations in earnings have very little effect on the value of that long-term stream.
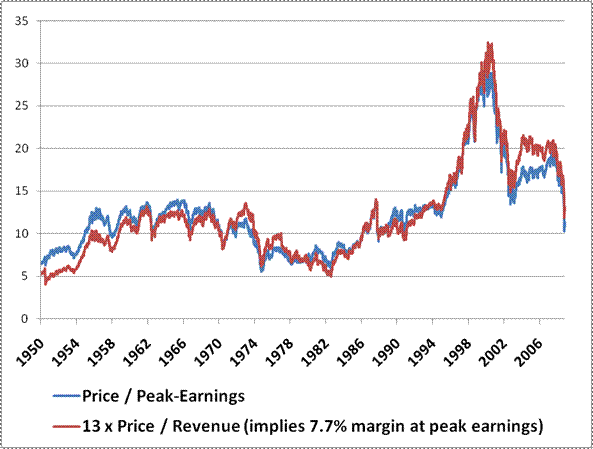
The chart below shows the valuation of the S&P 500 based on two reasonably smooth fundamentals. One is just the highest level of earnings achieved to-date (which grows in a stairstep fashion over time). The other is just 13 times the price/revenue multiple of the S&P 500. The scaling is done so that it can be compared with the P/E multiple, and essentially implies a fixed profit margin of 7.7% at peak earnings (I could get fancy and vary the assumed profit margin at each point in time based on historical data, but the only effect would be to make stocks appear a bit more overvalued in the 1960's and early 1970's, and a bit more undervalued today.) Both multiples are now modestly below their historical average and median levels.

The extent of the correction in valuations since 2000 is striking. Eight years later, despite a general expansion in earnings and the U.S. economy, an investment in the S&P 500 has lost a quarter of its value, including dividends.
Our 10-year total return projections for the S&P 500 Index ( standard methodology ) are presented below. The heavy line tracks actual 10-year total returns since 1950 (that line ends a decade ago for obvious reasons). The green, orange, yellow, and red lines represent the projected total returns for the S&P 500 assuming terminal valuation multiples of 20, 14 (average), 11 (median) and 7 times normalized earnings.

In a worst-case scenario, if stocks were priced at 7 times peak earnings a decade from now, total returns for the S&P 500 would come to just 4-5% over that decade. Of course, stocks would then be at valuations similar to 1982, so total returns over the following decade could be expected to exceed 12% in the worst case scenario, with probable returns closer to 20% annually over the following 10 years (all of which implies that stocks are priced to deliver total returns of about 10% annually over the next 20 years almost regardless of the path they take).
See Also: Grantham: Stocks Could Drop Another 50% But Still Time To Buy

